Water quality and human impacts
* water.epa.gov See teacher background →
Lessons
# Water quality and topography
Students learn about water quality through an e-learning course, then explore topographic maps available from USGS. Go to store.usgs.gov/maps to search for a map of your area of interest. These maps can be downloaded or ordered in printed format. Laminating the maps allows students to mark areas of interest on the map. These maps can be downloaded or ordered in printed format. Laminating the maps allows students to mark areas of interest on the map.
Files
# Runoff and BOD
Students take the Water Quality e-learning course, then complete water quality testing of samples and determine how the results will determine biological oxygen demand and recovery of the water source.
Files
# Impervious surfaces
Students read about the impacts of impervious surfaces and complete water quality tests on streams that have differing amounts of impervious surfaces and development around them.
Files
Teacher background
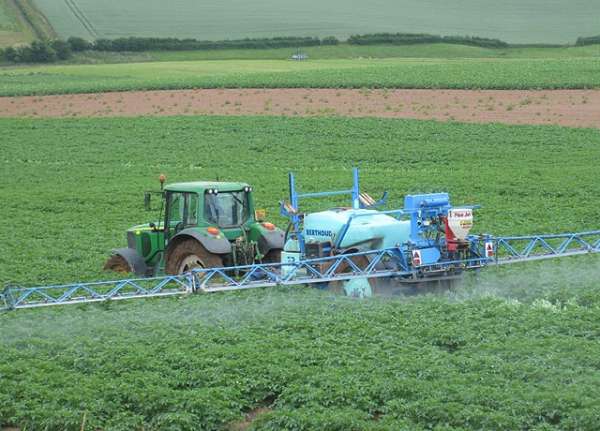
Pollutants can enter water to change water quality through various routes. Both point source and non point source pollutants cause problems. Point source pollutants come from known outlets (sewage pipe or effluent from industry) while non point source pollutants include run off from multiple places and the amounts that come from each area are not clear. For example: salt from roads, fertilizer from fields. Fertilizer contains nutrients such as nitrates and phosphates.
- Nutrients from fertilizers, human or animal wastes play a role in polluting waterways, as well. Here are the levels at which these nutrients may cause problems in waterways.
- Nitrate-nitrogen Levels exceeding 50 mg/L (ppm) are considered unhealthy for lakes. It is recommended 0–1 ppm and 1–5 ppm for optimum growth in freshwater systems.
- Phosphorous Discharge Standards: Total Phosphorous for discharge < 100 micrograms/L; Where stream enters lake < 50 micrograms/L; Discharge into a lake < 25 micrograms/L. (Note: microgram/L are equivalent to parts per billion)
Other factors affecting wildlife in water ecosystems include: Dissolved oxygen which is the amount of gaseous oxygen (O2) dissolved in an aqueous solution. Oxygen gets in the water by diffusion from the surrounding air, by aeration (rapid movement), and as a waste product of photosynthesis. Recommended minimum levels for fresh water fish are as follows: warm water fish: 5.0 mg/L (ppm) and cold water fish: 6.0 mg/L (ppm). Temperature is another abiotic factor that affects ecosystems in many ways. The higher the temperature of water, the lower the amount of dissolved oxygen water can hold. The opposite is also true: the lower the temperature, higher amounts of oxygen can be dissolved in the water. Biochemical/biological oxygen demand (BOD) is the amount of dissolved oxygen that must be present in water in order for microorganisms to decompose the organic matter in the water. It is used as a measure of the degree of pollution. pH is a measure of how acidic or basic a substance is. The pH scale ranges from 0 to 14. A pH of 7 is neutral. A pH greater than 7 is basic. The pH scale is logarithmic and as a result, each whole pH value below 7 is ten times more acidic than the next higher value (For example, a pH of 4 is 10 times more acidic than 5, and 100 times more acidic than 6) and each whole pH value above 7 is ten times more basic than the next lower value. Recommended values for pH in aquatic ecosystems range from 6–8.
Resources for further learning
Next gen science standards
Science and engineering practices
- Analyzing and interpreting data
Crosscutting concepts
- Patterns
- Cause and effect
- Stability and change
Disciplinary core ideas/content
- ESS3C Human impacts on Earth systems
- LS1D Information processing
- LS2A Interdependent relationships in ecosystems
- LS2C Ecosystem dynamics, functioning and resilience
- ETS2A Interdependence of science, engineering and technology


Share this